13-Week Cash Flow Forecast Template: Free Excel Download

When revenue looks strong but the bank account still cannot cover payroll, the problem is usually timing. A 13-week cash flow forecast template gives you a rolling weekly view of cash in, cash out, and ending balance, so you can spot shortfalls before they become a real cash crisis.
This guide explains the methodology and includes a free 13-week cash flow forecast template you can use in Excel or copy into Google Sheets. It also covers the weekly update process that keeps the forecast accurate and useful.
Choose your format:
| Option | Best for |
|---|---|
Download (.xlsx) | Best if you want a local spreadsheet, offline editing, and direct control over the file. |
Open document | Best if you want the fastest setup, browser access, and a live copy you can share immediately. |
App Store Google Play | Best if you want the same 13-week method without formula upkeep, manual roll-forward, or file versioning. |
The core concept
The margin for error is thin. According to the Federal Reserve's 2025 Report on Employer Firms, 56% of firms struggle to pay operating expenses due to uneven cash flows. A separate JPMorgan Chase Institute study found a typical small business holds roughly a 14-day cash buffer. That is barely two weeks between a delayed invoice and a missed payment.
What a 13-week forecast is and what it shows
The model uses the direct method: it tracks actual cash movements, not accrual accounting entries. Every week, it answers one question: How much cash will actually be in the account? If terms like headroom, net cash flow, or cash buffer are unfamiliar, keep the Cash Flow Glossary open alongside this guide.
Six outputs, tracked each week:
Why 13 weeks
Thirteen weeks equals one fiscal quarter — the sweet spot between daily noise and annual guesswork. Weekly buckets capture payroll cycles, tax deadlines, rent, and seasonal patterns with enough precision to make actual decisions.
| Feature | 13-Week Cash Forecast | Monthly Cash Forecast | 12-Month Budget |
|---|---|---|---|
| Horizon | Weekly | Monthly | Monthly / Quarterly |
| Best for | Liquidity management | Short-term planning | Strategic planning |
| Update cadence | Weekly | Monthly | Annual |
| What it catches | Timing gaps | Profitability gaps | Long-range risks |
| Accuracy | Highest in Weeks 1-4 | Moderate | Lowest |
| Method | Direct | Indirect / Direct | Indirect |
The methodology: what you actually need
A 13-week forecast requires three inputs and one weekly habit:
- Your current bank balance — cleared, unrestricted cash.
- Expected inflows by week — when money actually hits the bank, not the invoice date.
- Expected outflows by week — when money actually leaves the account, not the accrual date.
- A weekly review — replace forecasts with actuals, extend the horizon by one week, confirm there are no surprises.
The software or spreadsheet you use is secondary. The forecast only works if you actually know when cash enters and leaves the business.
Four steps to your first forecast
- 1
Enter your current bank balance
Use cleared, unrestricted cash only. Pending deposits and authorized-but-unsettled charges stay out. This is your anchor.
- 2
Set your minimum cash buffer
A practical starting point is 3-4 weeks of fixed costs: payroll, rent, core subscriptions, and taxes. For context, JPMorgan research found the typical small business holds only about two weeks of cash — so 3-4 weeks puts you meaningfully above the median. Seasonal or highly variable businesses should aim higher. Treat this number as untouchable — it is your do-not-cross line.
- 3
Enter confirmed inflows
Start with money that is already committed: signed contracts, scheduled recurring payments, deposits with confirmed dates. Place each in the week the cash will actually clear the bank. Add probable inflows after, but keep them clearly separate from confirmed ones.
- 4
Enter committed outflows
Payroll, rent, loan repayments, tax installments, vendor invoices with fixed due dates. Use the exact date the funds leave your account, not the date you receive the bill.
Once these four steps are done, you have a forward-looking cash position for the next 13 weeks. Everything after this is about keeping it accurate.
Two ways to run it
The methodology above is tool-agnostic. Below are two concrete execution paths. Pick the one you will actually update every week — that matters more than which tool you choose.
Path A: spreadsheet
The spreadsheet path gives you full control over the layout, but you own the upkeep.
If you want a ready-made starting point, use either the free Excel template (.xlsx) or the Google Sheets template copy link. Use Google Sheets if you want a live shared file immediately. Use Excel if you want a local .xlsx first. Then replace the dates, starting cash, buffer, and categories with your own.
What the spreadsheet template already includes
-
13-Week Forecast.The main sheet for beginning cash, inflows, outflows, ending cash, minimum cash buffer, and headroom. -
Downside Scenario.A second sheet for testing slower collections, earlier tax outflows, or an unexpected cost without breaking your base case. -
How to Use.A short instruction sheet for anyone else who needs to update the file. -
Simple visual cues. Input cells are highlighted, calculation rows update automatically, and negative headroom is easy to spot.
-
A suggested week-ending date and reminder. The sheet helps first-time setup and warns when the forecast window is stale.
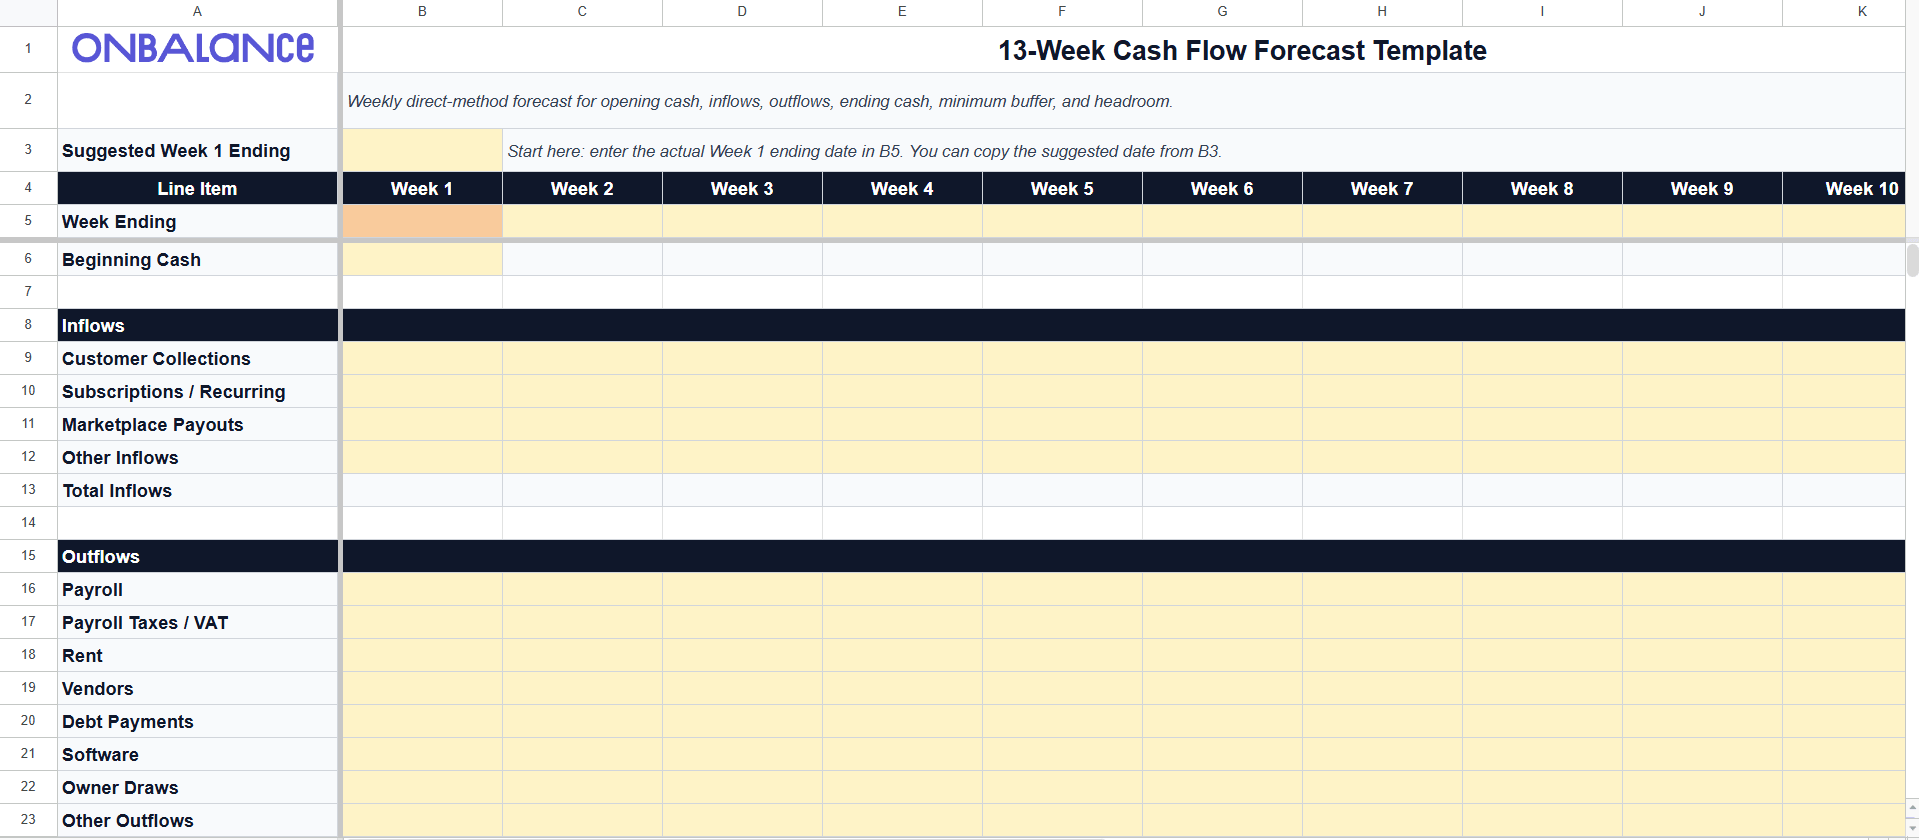
Caption: The downloadable template gives you a clean weekly layout, highlighted input cells, and automatic cash and headroom calculations.
Layout
Use 13 week-ending columns labeled Week 1 through Week 13. Build the rows in this order:
| Row | What goes here |
|---|---|
| Beginning Cash | Cleared cash at the start of the week |
| Inflows | 2-6 lines: collections, subscriptions, payouts, other inflows |
| Total Inflows | Sum of inflow lines |
| Outflows | 6-12 lines: payroll, taxes / VAT, rent, vendors, debt, software, owner draws |
| Total Outflows | Sum of outflow lines |
| Net Cash Flow | Inflows minus outflows |
| Ending Cash | Beginning cash plus net cash flow |
| Minimum Cash Buffer | Minimum safe balance |
| Headroom | Ending cash minus buffer, plus available credit line if you track it |
Core formulas
-
Ending Cash = Beginning_Cash + SUM(Inflows) - SUM(Outflows) -
Next Week Beginning Cash = Previous_Week_Ending_Cash -
Headroom = Ending_Cash - Minimum_Required_Buffer
The real cost of the spreadsheet path
If you build the model from a blank sheet, the first version usually takes 30-90 minutes. Starting from the template removes most of that setup time. The weekly update still takes 15-45 minutes because you still need to pull bank data, reconcile actuals, and refresh assumptions.
This is a manual roll-forward template. It does not shift weeks automatically when time passes. That is intentional: auto-moving columns in a simple spreadsheet usually create more confusion than clarity.
Spreadsheet roll-forward mechanics
After you finish the weekly review, the spreadsheet-specific update is simple:
- 1
Save a copy first.
Keep last week's version or duplicate the sheet before updating the next cycle.
- 2
Set the new Week 1.
Change
B5to the new week-ending date and enter actual starting cash inB6. If you are starting fresh, copy the suggested date shown inB3intoB5. - 3
Shift planned inputs left by one column.
Move
C9:N12intoB9:M12, then moveC16:N23intoB16:M23. - 4
Reset the far-right week.
Empty
N9:N12andN16:N23, then enter the new Week13assumptions.
Spreadsheets also fail quietly. Research summarized in this spreadsheet error review found that Panko field audits reported errors in 94% of spreadsheets, and a Dartmouth/Tuck audit of 50 operational spreadsheets found 86-94% contained errors. In a roll-forward model, one broken cell can distort every later week.
The bigger issue for most founders is friction. Pulling bank data, checking cleared transactions, and updating rows every Friday takes time. The file also tends to spread across emails, shared drives, and devices. Once the spreadsheet stops getting updated, the forecast stops being useful.
Path B: onbalance
The same methodology, different execution. Instead of maintaining formulas and columns, you maintain dated entries. The app handles the rolling balance.
onbalance is a free cash flow app for manual planning. No bank sync required. It is built for privacy-first and offline-first use, so you can run the same workflow without spreadsheet maintenance.
Here is how the 13-week workflow maps to the app:
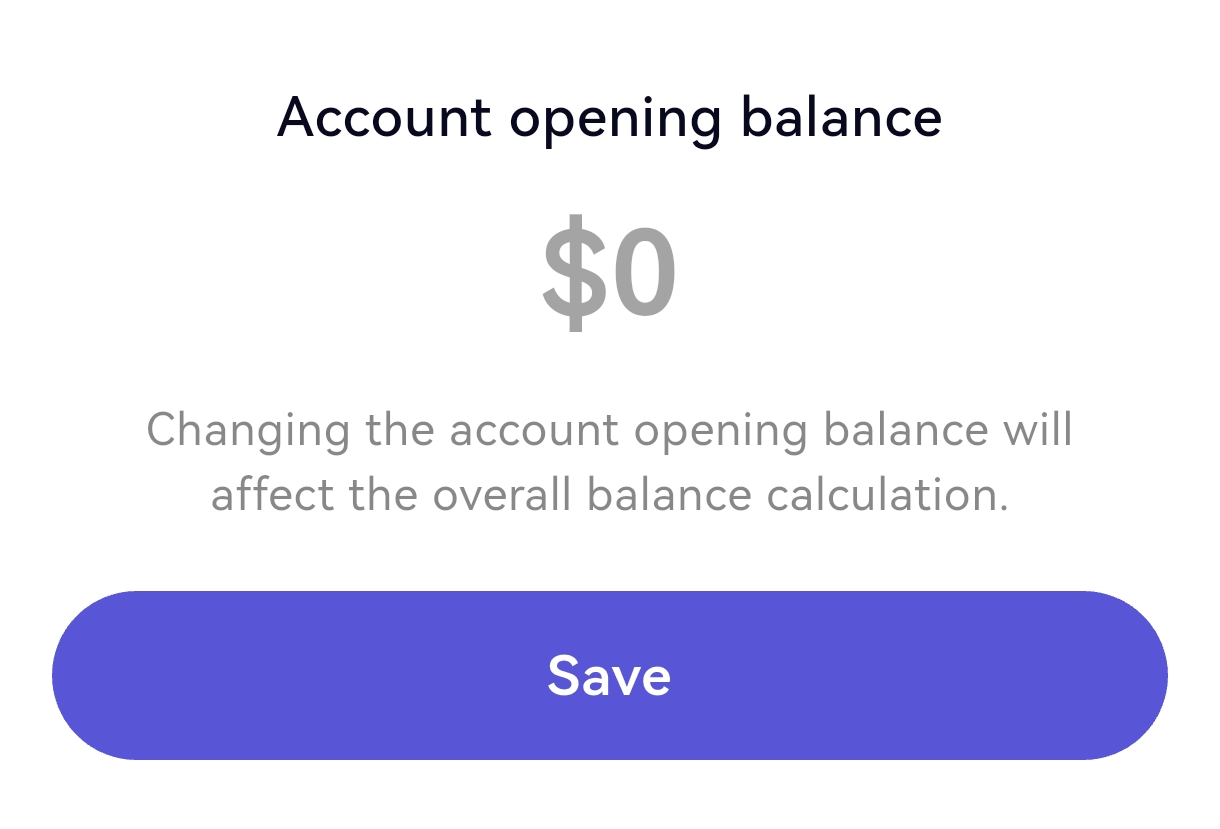
Step 1. Start with your balance
Start with the current account balance. If you already use onbalance, it is already there. If not, add it once and use it as the baseline for the forecast.
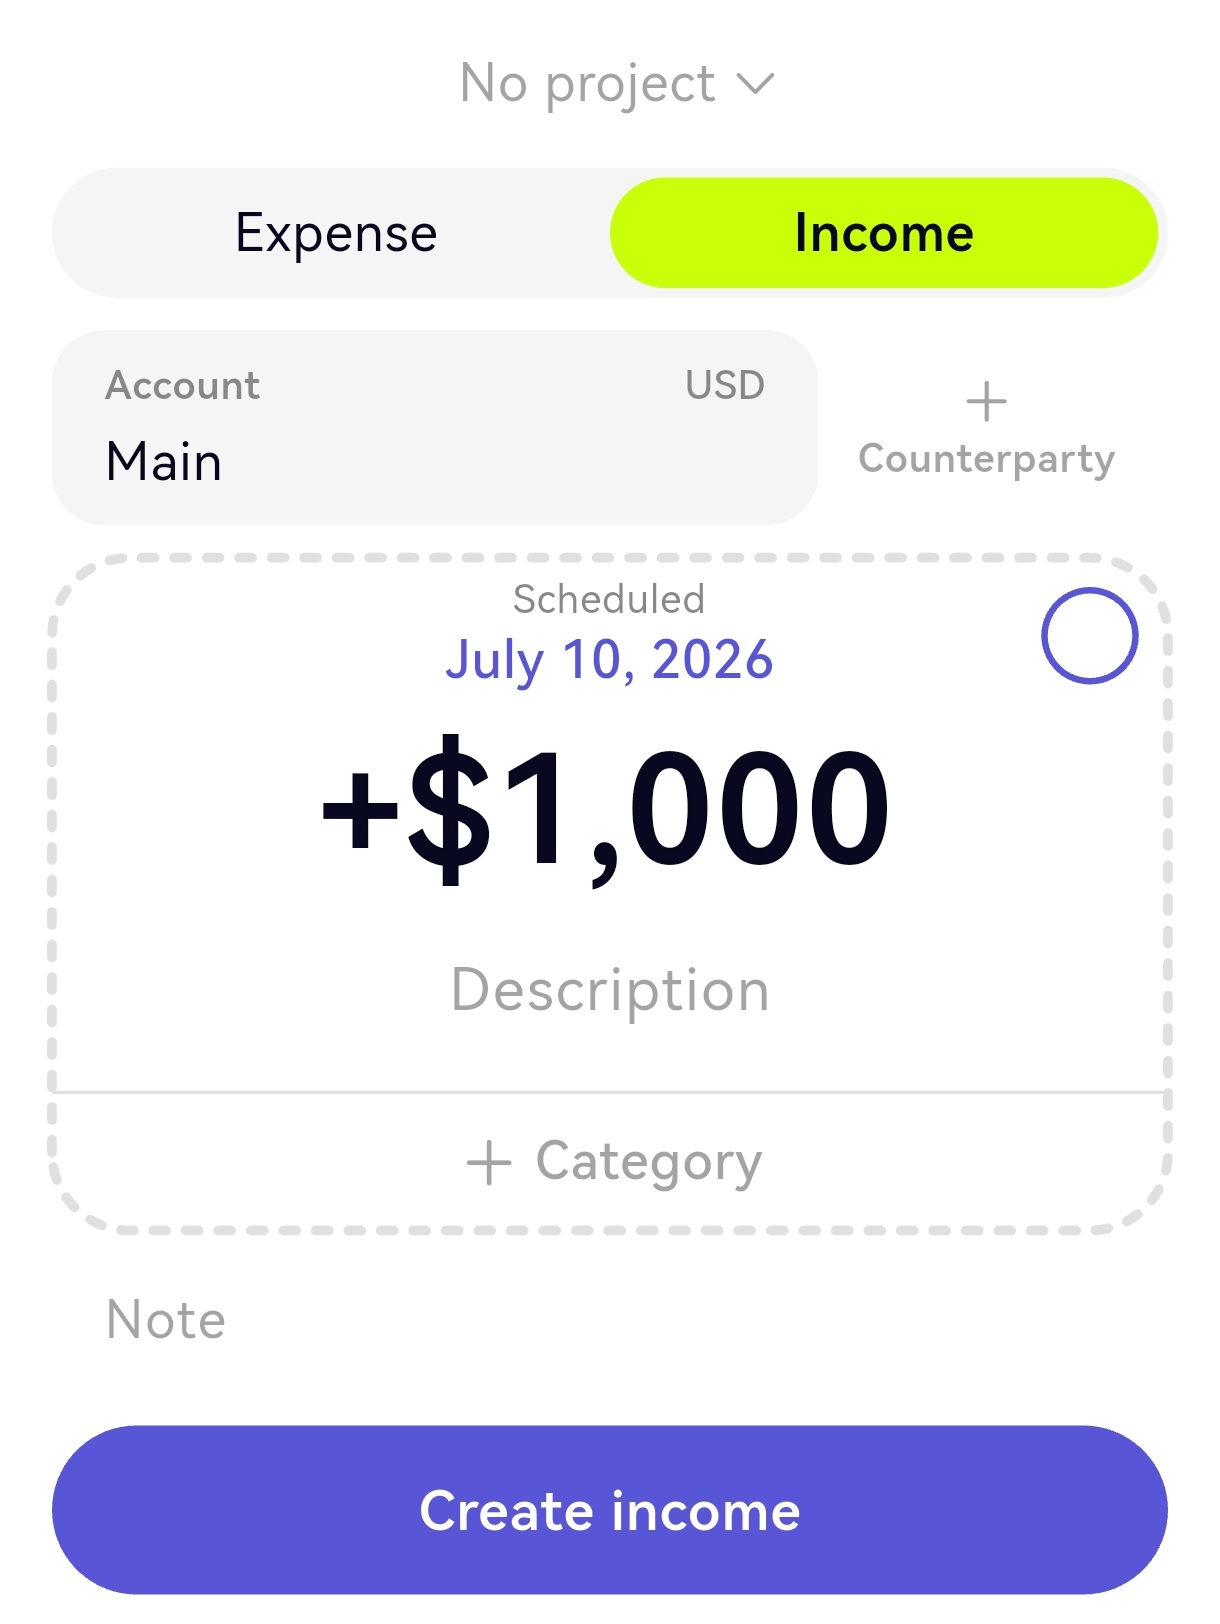
Step 2. Add planned inflows and outflows
Add planned income and expense entries for the next 13 weeks using the date cash should clear. Use categories for payroll, taxes, rent, vendors, and client payments. Use projects or notes only where timing needs context.
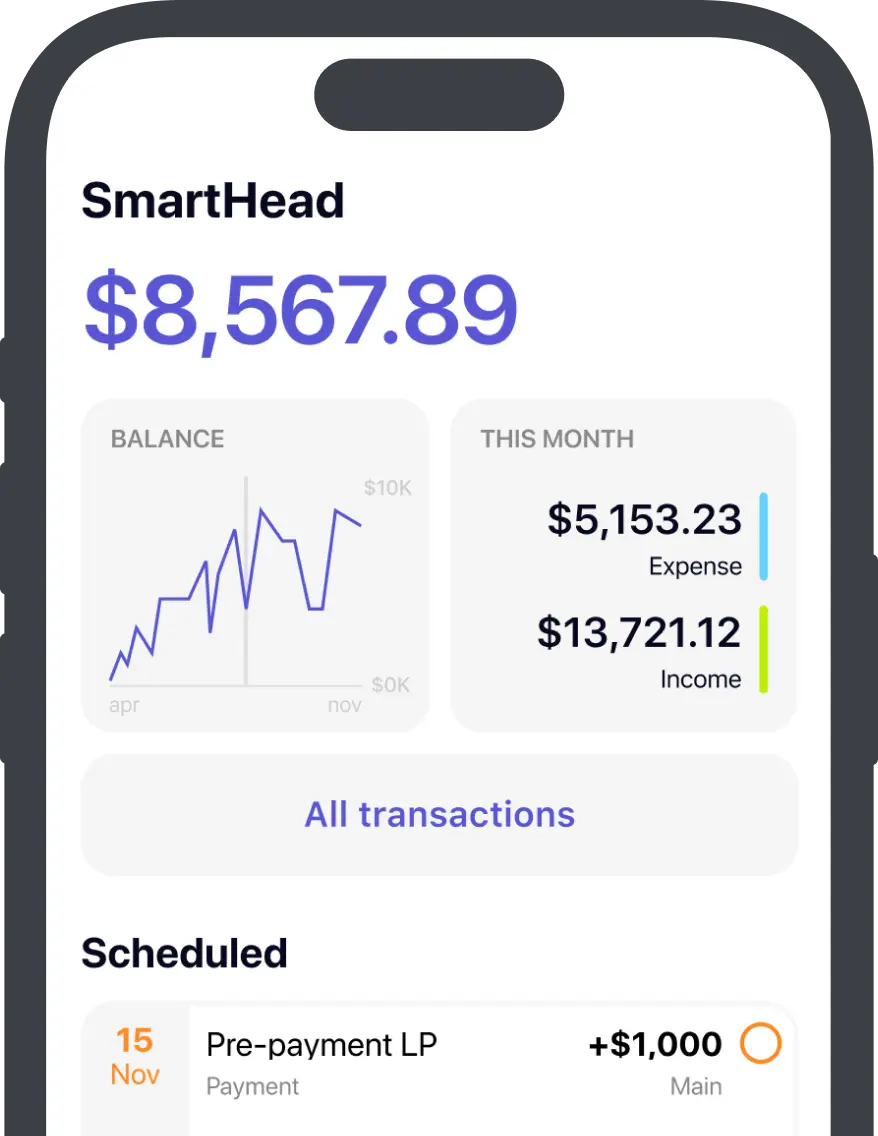
Step 3. Read the balance graph
The graph combines your current balance with planned entries across the 13-week horizon. If the projected line dips below your buffer, that is the week that needs attention.
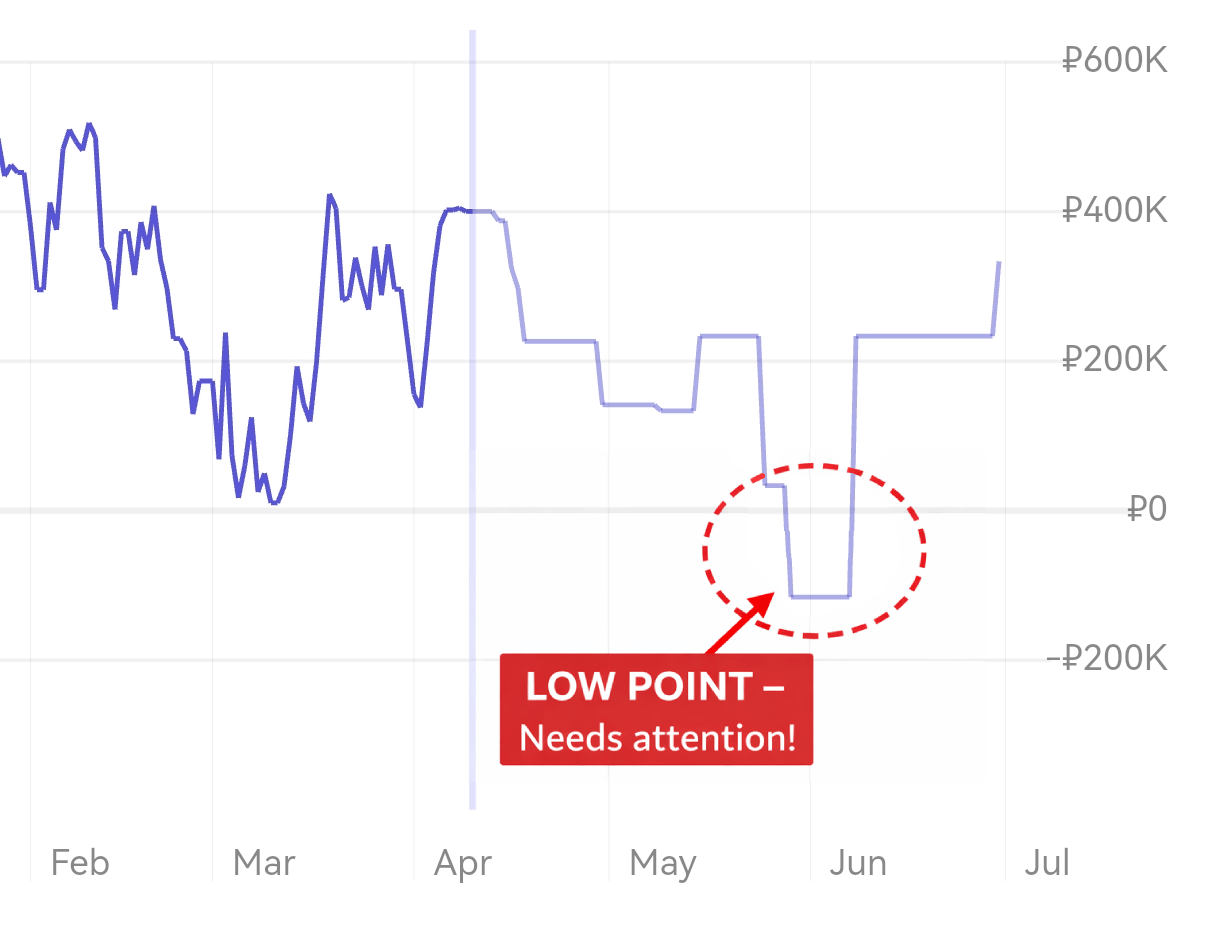
Caption: The projected balance graph makes the future low point visible immediately.
The weekly update
When a planned entry clears, confirm the actual date and amount, then add new planned entries so the horizon stays 13 weeks ahead.
There are no columns to shift, no formulas to fix, and no separate roll-forward step.
| Spreadsheet task | onbalance equivalent |
|---|---|
| Enter opening balance | Set opening balance once |
| Add confirmed inflows by week | Add planned income by date |
| Add committed outflows by week | Add planned expense by date |
| Calculate ending cash per week | See projected balance automatically |
| Roll-forward (drop Week 1, add Week 13) | Mark cleared entries actual; add new planned entries |
| Variance tracking | Compare planned vs. actual per entry |
| Formula maintenance | None |
Spotting a gap in practice
Consider a design agency where clients pay on Net 60 but contractors require Net 15.
During a Friday review, the founder saw that their projected balance for Week 7 dropped to negative $12,000. A quarterly tax payment collided with a large software renewal.
Because the gap was flagged six weeks in advance, there was time to fix it. The founder offered a client a 3% discount to pay an outstanding invoice early, securing the cash in Week 5. They also asked the software vendor to delay billing by two weeks.
The shortfall never materialized. The forecast didn't solve the problem, but it made the problem visible early enough to act.
The 15-minute weekly update ritual
Run this every Friday afternoon or Monday morning. The specific day matters less than consistency. Skip a week, and a living forecast becomes a stale, dangerous document.
- 1
Reconcile to actual cash
Start from the real closing balance for the week and replace forecasted Week
1numbers with actuals. - 2
Check variances
Compare what actually happened to what the forecast predicted. Large variances are signals — a client paid late, a cost was higher than expected. Understand why before moving on.
- 3
Extend the horizon
Add one new week so the forecast always covers the next 13 weeks.
- 4
Refresh the assumptions
Update expected collections, payroll, and tax dates based on new information from the past week.
- 5
Confirm headroom and next action
Check that the buffer stays positive across all future weeks. If any week turns negative, decide now what changes the timing gap: collections follow-up, delayed spend, or a financing backstop.
Accuracy benchmarks
Near-term weeks demand precision. Outer weeks provide direction. For project-based or seasonal businesses, 10-15% variance in Weeks 5-13 is normal. The goal is directional accuracy, not perfection. If something material changes mid-week, update the forecast then — do not wait for the weekly ritual.
5 mistakes that kill your forecast
Scenario planning: turn the model into an early-warning system
A single-scenario forecast creates false confidence. The goal is not to predict perfectly. The goal is to see which assumption breaks the cash position first and how much time you still have to respond.
Before pulling any lever, make the forecast answer three questions: which week breaks first, what assumption changed, and whether the problem is collections timing, spend timing, or a one-off shock.
In a spreadsheet, duplicate the tab and change one assumption at a time: a slower collection schedule, a delayed contract, or a surprise cost. In onbalance, add tentative entries or adjust dates, check the graph, then revert the change.
| Signal | Test next | Why it matters |
|---|---|---|
| Ending cash drops below your minimum buffer | Move receipts later and strip optimistic inflows | Timing optimism is a common source of error |
| Headroom turns negative later | Shift one inflow or one tax / payment date | Shows whether the gap is structural or timing |
| Receivables slip versus plan | Push receipts to the dates cash is most likely to clear | Shows the real trough |
| Payroll or tax weeks go red | Prepare the response plan before the week arrives | Tells you where action is needed next |
Keep the model honest: change one assumption at a time, compare the before-and-after ending cash, and resist the urge to turn the forecast into a wish list. If you need the full operating playbook for closing a real cash gap, use Cash Flow Forecasting for Small Businesses.
Complex cases
Marketplace sellers
If you sell through Amazon, Etsy, Shopify, or similar platforms, do not forecast gross sales. Model the net payout amount on the actual disbursement date.
Micro-checklist for e-commerce:
-
Account for rolling reserves — funds the processor holds back.
-
Subtract platform fees and ad spend before the money hits your bank.
-
Model return and chargeback buffers based on historical data.
Foreign currency (FX)
Convert foreign transactions into your primary operating currency using a conservative exchange rate. Do not rely on today's spot rate for an invoice that will pay out in eight weeks.
Multiple bank accounts
Forecast cash across every account that can pay bills.
-
Pick a primary operating account and track others as separate lines: Savings, Tax, Card Settlement.
-
Treat internal transfers as zero net — an outflow from one account and an inflow to another — so you do not double-count.
-
If taxes are paid from a separate account, fund that account on a schedule so the tax week does not surprise you.
FAQ
What should be included in a 13-week cash flow forecast?
At minimum: beginning cash, expected cash inflows, expected cash outflows, net cash flow, ending cash, and your minimum cash buffer. A useful template also makes headroom visible so you can see how far projected cash stays above or below your safe minimum.
How often should I update a 13-week cash flow forecast?
Weekly. In the spreadsheet version, that means updating Week 1, shifting planned inputs left, clearing the new Week 13, and refreshing assumptions. Once set up, the routine usually takes about 15 minutes.
How accurate should a 13-week cash flow forecast be?
The first 1-4 weeks should be as precise as possible because those weeks drive immediate decisions. Weeks 5-13 are usually more directional, especially in seasonal or project-based businesses. The goal is not perfect prediction. The goal is to spot timing gaps early enough to act.
What is the Cash Conversion Cycle and why does it matter here?
The Cash Conversion Cycle combines Days Inventory Outstanding (DIO), Days Sales Outstanding (DSO), and Days Payable Outstanding (DPO): CCC = DIO + DSO - DPO. See the glossary definitions for DIO, DSO, and DPO if you want the detailed breakdown. It measures how quickly cash moves through the business. A rising CCC tightens weekly balances in the forecast.
Can I build a 13-week forecast without an accountant?
Yes. You need three things: your current bank balance, expected money in, and expected money out. A formal general ledger is not required.
How to move forward
The 13-week cash flow forecast works only if it stays current.
If a spreadsheet fits your workflow, start with the free Excel template (.xlsx) or the Google Sheets template copy link and keep the weekly update routine simple.
If spreadsheet upkeep is what kills the habit, use onbalance instead. The method stays the same, but the maintenance drops.
Whichever tool you choose, the point is the same: see the cash gap early enough to do something about it.
This content is for informational purposes only and does not constitute financial, tax, or investment advice. Consult a qualified professional for guidance specific to your situation.
Cash flow tracking & future balance forecast with offline-first sync.
Get Started with onbalance